Australia's road toll is not coming down. In the 12 months to September 2026, 1,334 people were killed on Australian roads, according to the latest monthly figures from the federal road safety data hub (opens in a new tab), released on 14 October. That is 0.2 per cent more than the year before, and it follows four straight calendar years of increases.
It sits awkwardly beside the steady arrival of safety technology. Under the design rule announced in 2021, autonomous emergency braking (AEB, the system that brakes for you when it detects an imminent crash) was required on newly introduced light-vehicle models from March 2023 and on all models on sale from March 2025 (opens in a new tab). Yet the National Road Safety Strategy 2021–30 (opens in a new tab) set out to cut annual deaths by at least half by 2030, and the count is higher now than when the strategy began.
For anyone buying or selling a car, the useful part is the detail: who is dying, on which roads, in what kind of car, and what you can check first.
At a glance
- Road deaths, 12 months to Sept 2026
- 1,334 (up 0.2%)
- Deaths per 100,000 people
- 4.8, against a 2030 goal of under 2.0
- 2030 target
- Fewer than 571 deaths a year
- Average age of a registered passenger car
- About 11.5 years (Jan 2026)
- Sweden, 2025
- 20 deaths per million people
Four years going the wrong way
The calendar-year totals in BITRE's September 2026 bulletin (opens in a new tab) read like a staircase: 1,129 deaths in 2021, 1,182 in 2022, 1,252 in 2023, 1,291 in 2024 and 1,306 in 2025. This year's 1,001 deaths to September are 2.9 per cent ahead of the same point in 2025. September alone claimed 123 lives, 17.8 per cent above the average September of the previous five years. BITRE notes the recent months are preliminary and can be revised.
Population growth explains part of it. Measured per head, the rate for the 12 months to September was 4.8 deaths per 100,000 people, 1.3 per cent lower than a year earlier. But the per-capita line has also drifted the wrong way over the strategy's life: 4.4 in calendar 2021, 4.7 in 2025.
The strategy's own yardstick makes the gap plain. Its targets document (opens in a new tab) uses a baseline of 1,142 deaths a year (the 2018–20 average) and 4.5 deaths per 100,000, and aims for fewer than 571 deaths and a rate below 2.0 by 2030. The 2025 total of 1,306 was about 14 per cent above that baseline. On our arithmetic, reaching fewer than 571 in 2030 now means cutting the annual toll by more than 56 per cent in five years.
The picture differs by state. Over the 12 months, South Australia's toll rose 16.3 per cent to 107 and New South Wales's rose 2.6 per cent to 356, while Victoria's fell 9.7 per cent to 269. Per head, the Northern Territory remains far worse than anywhere else at 13.0 deaths per 100,000, against 3.8 in Victoria.
Who is dying
- 586
- drivers killed, 12 months to Sept 2026
- 264
- motorcyclists
- 206
- passengers
- 198
- pedestrians
Driver deaths fell 2.0 per cent, but drivers and passengers together still made up roughly six in ten of those killed. The rest were motorcyclists, pedestrians and cyclists (cyclist deaths jumped from 40 to 54): 516 people the data hub counts as vulnerable road users (opens in a new tab), up 1.8 per cent. That matters for the safety-tech argument. A five-star car is engineered first to protect the people inside it, and almost four in ten of those killed were never inside one.
Motorcyclists stand out. BITRE's Road vehicles Australia release (opens in a new tab) shows motorcycles were about 4.3 per cent of registered motor vehicles in January 2026, yet riders accounted for almost one in five road deaths. Registrations aren't kilometres ridden, so that is not a risk rate, but the gap is wide.
People aged 25 to 44 made up the largest share, 405 deaths. Child deaths (up to age 15) rose from 50 to 68, while deaths among 65 to 79-year-olds fell from 222 to 190. Men outnumbered women about 2.8 to one.
The country-road problem
The monthly bulletin puts 35.7 per cent of deaths in major cities, but BITRE warns that remoteness wasn't recorded for 101 deaths, so regional counts may be understated. Rates tell the story more cleanly. In the data hub's international comparison for 2023 (opens in a new tab), the death rate was 2.0 per 100,000 people in major cities, 7.7 in inner regional areas, 12.8 in outer regional areas, 19.3 in remote areas and 25.9 in very remote areas.
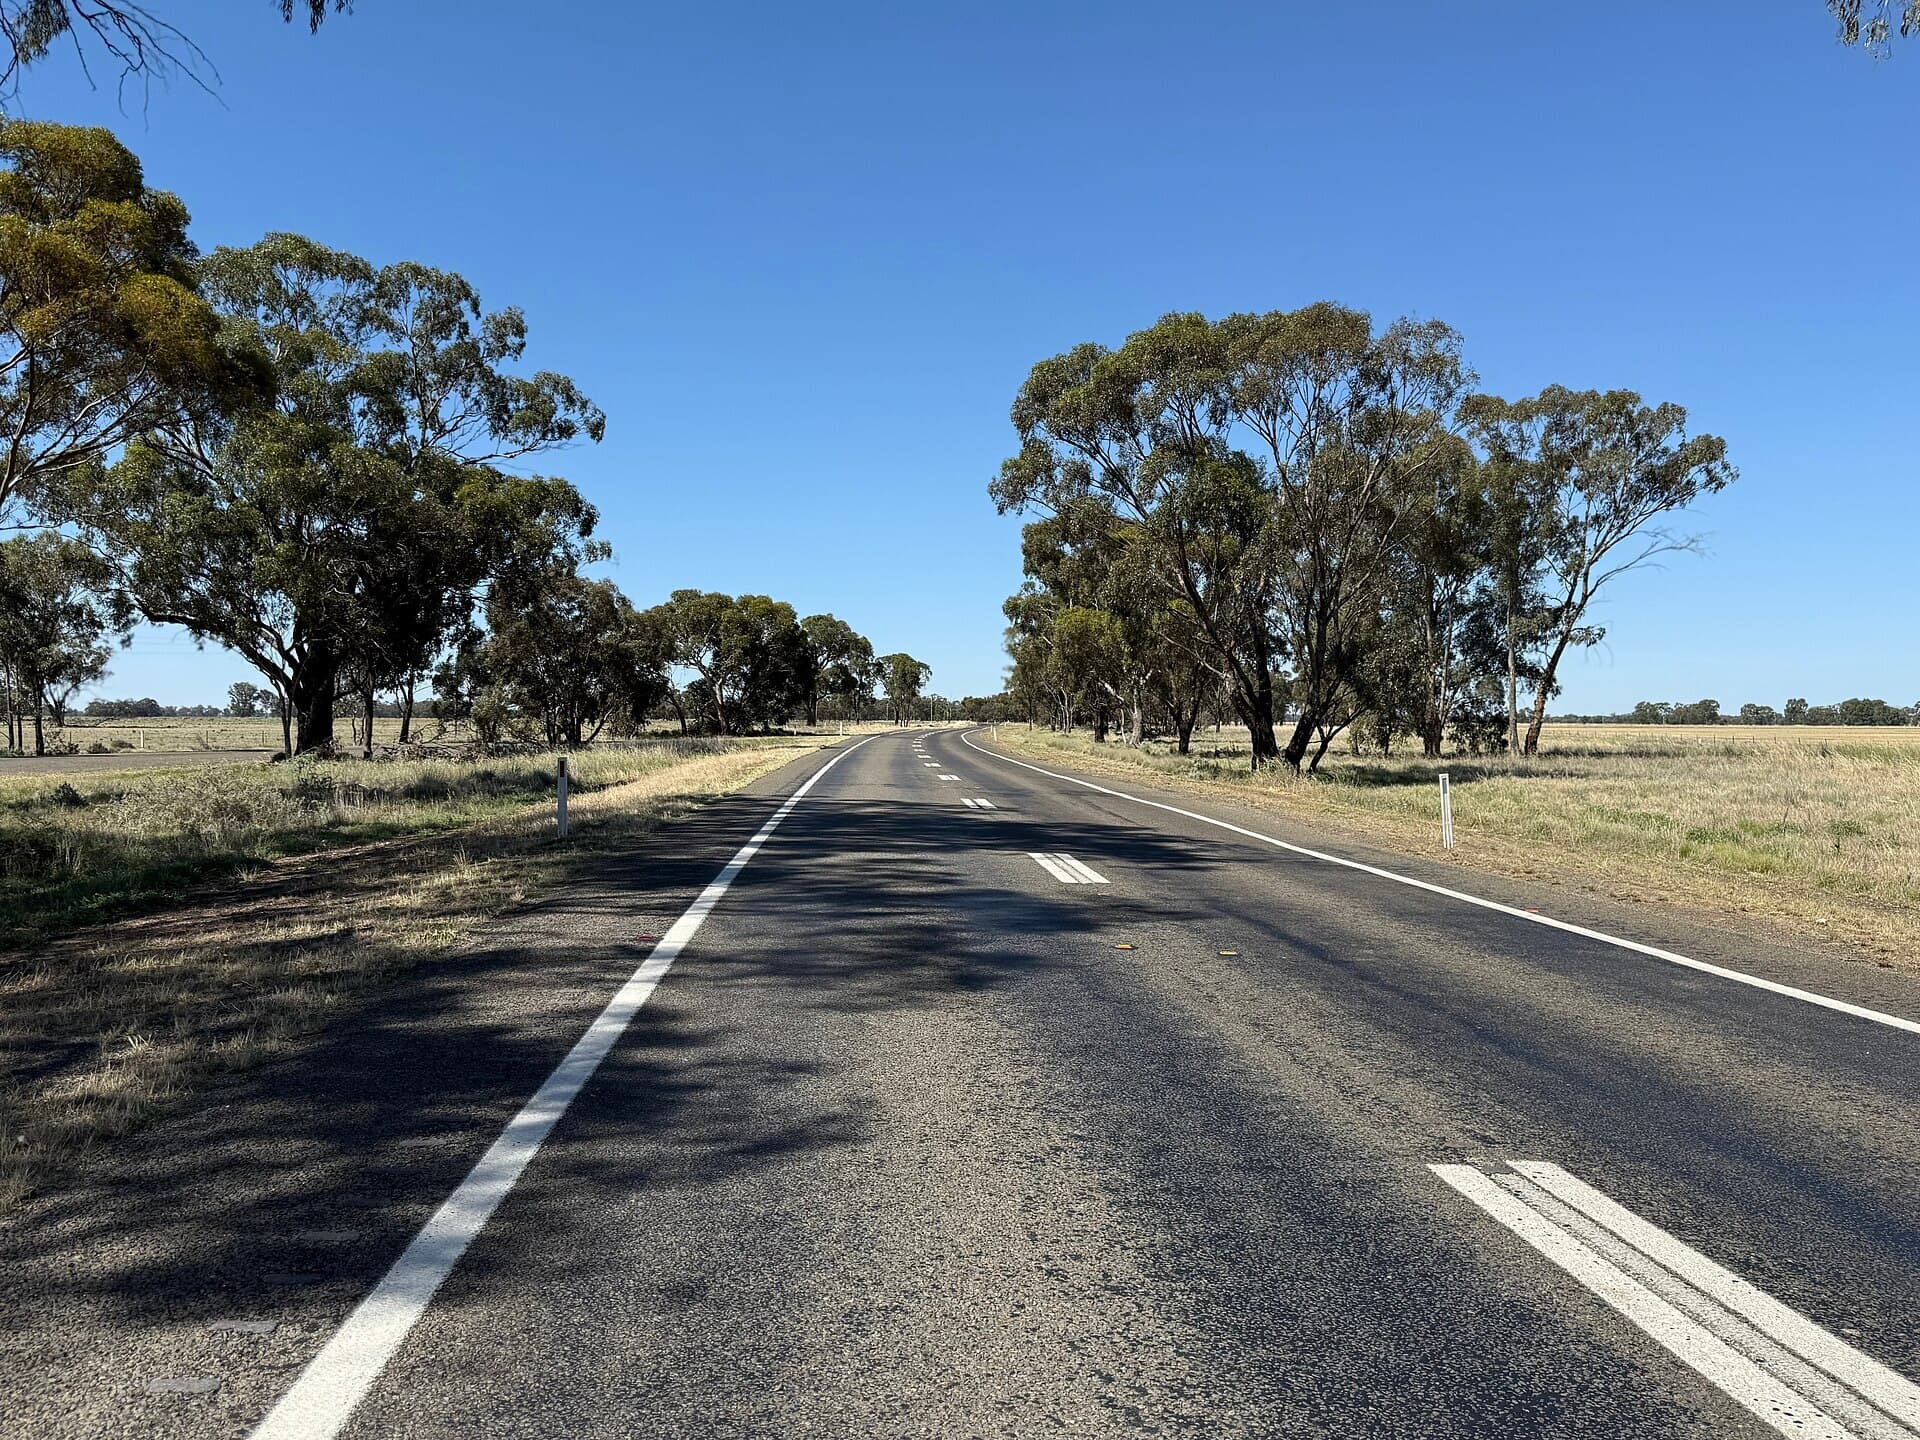
The strategy's regional road safety fact sheet (opens in a new tab), which the department says is being updated, explains why. It says 73 per cent of regional deaths came from lane-departure crashes (running off the road or hitting an oncoming vehicle head-on), on what are in many cases undivided single carriageways with poorer surfaces, roadside hazards and a default 100 km/h limit. The latest bulletin points the same way: single-vehicle crashes were 56.5 per cent of fatal crashes in the 12 months to September and rose 6.3 per cent, while multi-vehicle fatal crashes fell 4.2 per cent. One year is not a trend, and the data doesn't say why the two moved apart.
Safer cars, so why isn't it showing up?
We could not find a study that apportions the past four years' rise between causes. The official data does show forces working against the technology.
The fleet is old and getting older
According to BITRE (opens in a new tab), the average registered passenger vehicle was about 11.45 years old in January 2026, up from 11.33 a year earlier.
The strategy's 2030 outcomes (opens in a new tab) include an average light-vehicle fleet age under nine years. The same document cites ANCAP analysis from 2017: vehicles built before 2000 were 20 per cent of the fleet but featured in 33 per cent of fatal crashes, while vehicles built from 2011 to 2016 were 31 per cent of the fleet and involved in 13 per cent. It also concedes, "We did not see any reductions in the age of the vehicle fleets under the previous strategy."
The lag is obvious. If the average registered passenger car is about 11.5 years old, it was built around 2014, nine years before AEB became compulsory on newly introduced models.
What the technology covers, and what it doesn't
AEB is effective at the crash it was designed for. The How Safe Is Your Car site (opens in a new tab), which publishes the Used Car Safety Ratings, says car-to-car AEB has been estimated to reduce rear-end crashes causing death and serious injury by 27 per cent. But most fatal crashes involve a single vehicle, and a car drifting off a country road on a bend at night is a different problem. The strategy's vehicle safety fact sheet (opens in a new tab) expects lane-keeping technology to help with run-off-road and head-on crashes, and notes that edge line marking likely does more for a car with lane-departure warning.
ANCAP's 2026 rule changes (opens in a new tab) now check whether AEB still stops for people in different clothing, at night or in rain, because, in its words, "crash avoidance features should work in real-world conditions, not just lab conditions."
Distraction: what is known and what isn't
ANCAP has also moved on screens. From 2026 it is asking manufacturers to provide physical buttons for important controls such as the horn, indicators, hazard lights, windscreen wipers and headlights, or to dedicate a fixed part of the display to those functions. Its fact sheet puts it bluntly: "It's time to bring back buttons and stalks." It's a rating criterion, not a law; we made the case in Bring back the buttons (opens in a new tab).
What nobody can tell you is how many of the 1,334 deaths involved a distracted driver. The strategy's risky road use fact sheet (opens in a new tab) says fatigue and distraction "are more difficult to study and quantify." The data hub's national breakdown of risky behaviour in fatal crashes (opens in a new tab) covers drink driving, drug driving, unlicensed driving and seatbelts, and publishes no distraction figure. It does record 330,926 mobile-phone fines in 2024, 87.6 per cent of them issued by cameras.
Speed, enforcement and the road itself
Of the behaviours that are measured, drug driving has become the most common in fatal crashes: involved in 16.8 per cent of fatal crashes in 2023, up from 10.3 per cent in 2015, according to the data hub (opens in a new tab). Not wearing a seatbelt featured in 14.7 per cent and drink driving in 12.0 per cent. Police conducted 10.3 million random breath tests in 2024, against 15.2 million in 2019.
About a quarter of fatal crashes, 324, happened in 100 km/h zones in the 12 months to September, a figure that fell 10.2 per cent, according to the monthly bulletin (opens in a new tab).
Then there is the surface under the tyres. The Grattan Institute's Potholes and pitfalls report (opens in a new tab) describes local roads as being in "a state of dangerous disrepair, especially in the bush" and says they need an extra $1 billion a year; it also found a quarter of councils don't know exactly which roads and bridges they manage. Our state-by-state pothole investigation (opens in a new tab) tracks the backlogs. The federal data hub's road roughness map (opens in a new tab) only covers 2017 and 2018, and we could not find national evidence tying road condition to a specific share of deaths.
The world view
Australia is not alone in stalling, but it is falling behind. The data hub's international comparison (opens in a new tab) of OECD countries for 2023 put Australia's rate at 4.7 deaths per 100,000, ranked 20th of 34. Norway (2.0), Iceland (2.1) and Sweden (2.2) were at the safe end. Between 2014 and 2023, Australia's per-population rate fell 3.6 per cent while the OECD median fell 18.6 per cent.
Europe is also struggling. The European Commission's preliminary 2025 figures (opens in a new tab) count about 19,400 deaths, down 3 per cent, with most member states not on track to halve deaths by 2030 and rural roads accounting for 53 per cent of deaths in 2024. Sweden recorded 20 deaths per million people in 2025, equivalent to 2.0 per 100,000.
Another perspective: Sweden
Australia's strategy borrows its end goal, Vision Zero, from Sweden. Trafikverket (opens in a new tab), the Swedish Transport Administration, says the idea was first presented publicly in 1995 and that in autumn 1997 the Swedish Parliament adopted it, by a large majority, as the basis of road safety work.
What Sweden actually did
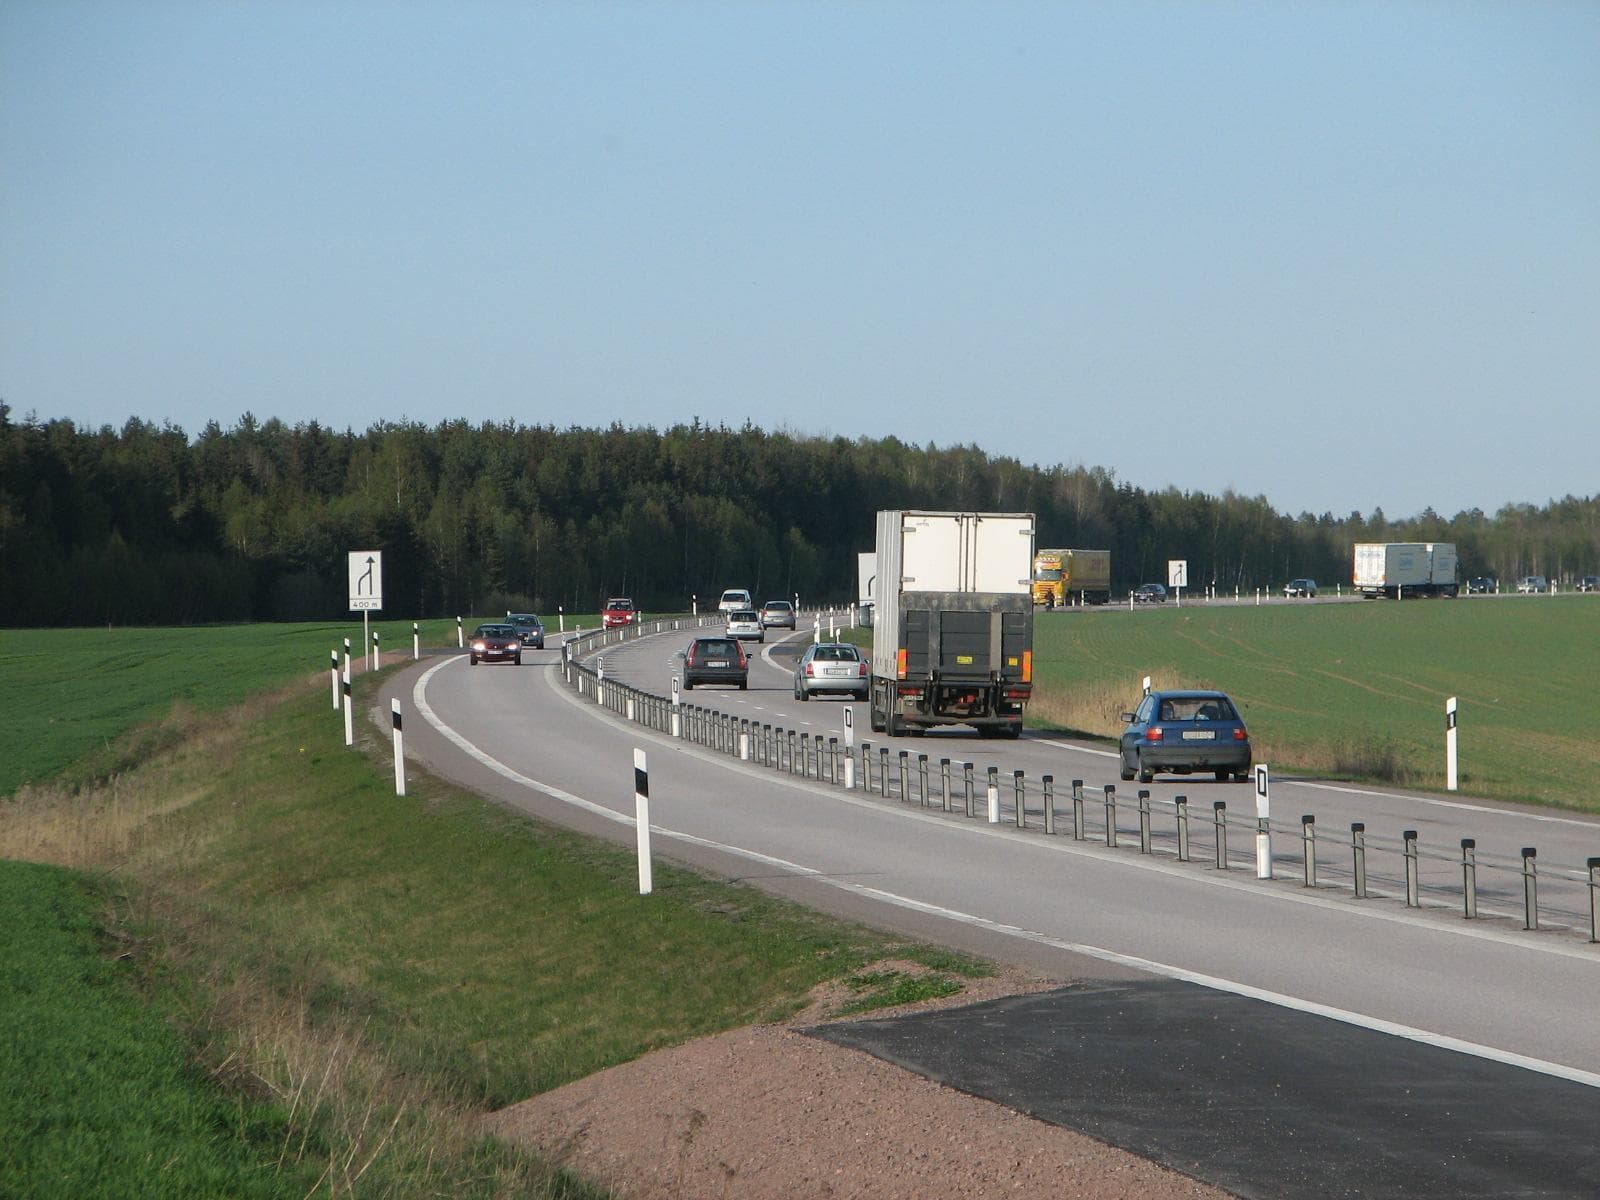
Built roads that forgive mistakes. The first median barrier went up as a pilot in summer 1998 on a stretch with a history of fatal crashes. Trafikverket says the trial "was greeted with considerable scepticism" but worked extremely well at preventing head-on collisions (opens in a new tab). Median barriers now run along motorways and 2+1 roads, which alternate two lanes in one direction and one in the other, with the barrier between. In the decade to 2024, Trafikverket says about 800 kilometres of new 2+1 road and more than 1,500 new safety cameras (opens in a new tab) were added.
Set speed by the road, not by habit. Under Trafikverket's speed management approach (opens in a new tab), rural roads get a limit above 80 km/h only if opposing traffic is separated, except roads carrying little traffic. Safety cameras target the most hazardous roads, and Trafikverket says fewer than 5 per cent of vehicles exceed the limit at them.
No one single factor means as much to safety in road traffic as speed.
Renewed the fleet. Trafikverket (opens in a new tab) names the switch from older cars to newer, safer models as one of the most tangible reasons deaths have fallen.
What happened
In January 2025, Trafikverket said annual deaths had fallen 60 per cent from more than 500 a year 25 years earlier, despite more traffic, and by 19 per cent between 2014 and 2024 while traffic grew about 4 per cent. The Swedish Transport Agency's preliminary count for 2025 (opens in a new tab) is 208 deaths, the second-lowest on record, in a year when car and heavy-vehicle travel rose almost 3 per cent.
It isn't finished. Sweden's goal is no more than 133 deaths in 2030, and Trafikverket says nearly half of road users still exceed the limit; full compliance, it estimates, would save about 50 more lives a year. Barriers carry a cost too: Trafikverket's motorcycle safety page (opens in a new tab) says about four or five motorcyclists and as many car drivers die each year hitting them, against an estimated 80 lives a year that barriers save.
What Australia can take
| Feature | Australia | Sweden |
|---|---|---|
| Deaths per 100,000 (2023) | 4.7 | 2.2 |
| 2030 goal | Fewer than 571 deaths | No more than 133 deaths |
| Rural speed rule | 100 km/h default on many undivided roads | Over 80 km/h only where traffic is separated, bar quiet roads |
| Road treatments | Fact sheet lists audio-tactile lines, wire rope barriers, wide centrelines | About 800 km of new 2+1 road with barriers, 2014 to 2024 |
Sweden's road network is not Australia's, and a barrier on every kilometre of the Newell Highway is not a serious proposal. The transferable lesson is the method: match speed limits to how forgiving the road is, spend on the corridors where head-on and run-off crashes cluster, and keep measuring. Australia's regional fact sheet already lists the low-cost tools; the gap is applying them at scale.
What it means if you're buying or selling
If you're buying
Read both safety ratings, and read the date. ANCAP says its tests get harder every three years (opens in a new tab) and recommends a vehicle with the highest rating and a date stamp no older than six years. A rating never expires, so a car rated five stars in 2012 keeps that rating for life, even though it was tested to older, easier criteria. Used Car Safety Ratings, produced by Monash University Accident Research Centre, are built from real police-reported crashes (opens in a new tab); look for five stars and a Safer Pick marker. Our guide to ANCAP versus Used Car Safety Ratings (opens in a new tab) walks through checking both.
Confirm AEB on the exact car, not the model name. Because the mandate phased in from March 2023, earlier cars may or may not have it depending on the variant. Check the build date and the specification.
Treat the cheapest old car with suspicion. The pre-2000 over-representation in fatal crashes is the strategy's own figure. Some cars from that era also carry a live airbag recall: Takata NADI 5-AT airbags in about 85,000 vehicles built between 1996 and 2001, from brands including Ford, Honda, Mazda and Toyota, are being urgently recalled (opens in a new tab) because moisture can degrade the propellant and a deploying airbag could then propel sharp metal fragments into the cabin.
Match the car to your roads. On undivided country highways the crashes that kill are most often run-off and head-on crashes, so lane support, strong crash protection and good tyres earn their keep.
If you're selling
Put the safety facts in the listing: the ANCAP rating and the year it was tested, the Used Car Safety Rating, AEB and lane support if fitted, and proof that any recall work is done. We couldn't find Australian data putting a dollar figure on what these features add to a used car's price, so don't promise a buyer they're getting a bargain because of them. If you buy, sell & show on MotorLoop, put those details in the description.
Our take
This is our view. Cars have got safer and the deaths haven't followed, because a new car is a small part of a big, ageing system. The average registered car is about 11.5 years old, almost four in ten people killed weren't inside a car at all, and most fatal crashes involve a single vehicle, often on country roads with little margin for error.
On current numbers, we don't think the 2030 target is reachable. Cutting the toll by more than half in five years would take the kind of sustained, unglamorous work Sweden has done for nearly three decades: separating traffic on the busiest country roads, setting limits that match the road, and enforcing them consistently.
Drivers matter more than any feature list. We welcome ANCAP pushing for physical buttons, because controls you can find without looking keep eyes on the road. AEB and lane support are real advances, but they work best for an attentive, skilled driver on a properly marked road. We also want governments to measure what they say matters: national data on distraction and road condition is thin or years old.
The evidence does push against one of our instincts. We like simple, repairable cars and keeping a good car running, yet the oldest cars are over-represented in fatal crashes. Our answer: simple and old aren't the same thing. A car from the past decade with a strong Used Car Safety Rating, AEB and real buttons can still be straightforward and owner-friendly. Be wary of the cheap 1990s car.
Header photo: Perpetual-yearning (opens in a new tab) via Wikimedia Commons, CC BY 4.0 (opens in a new tab).