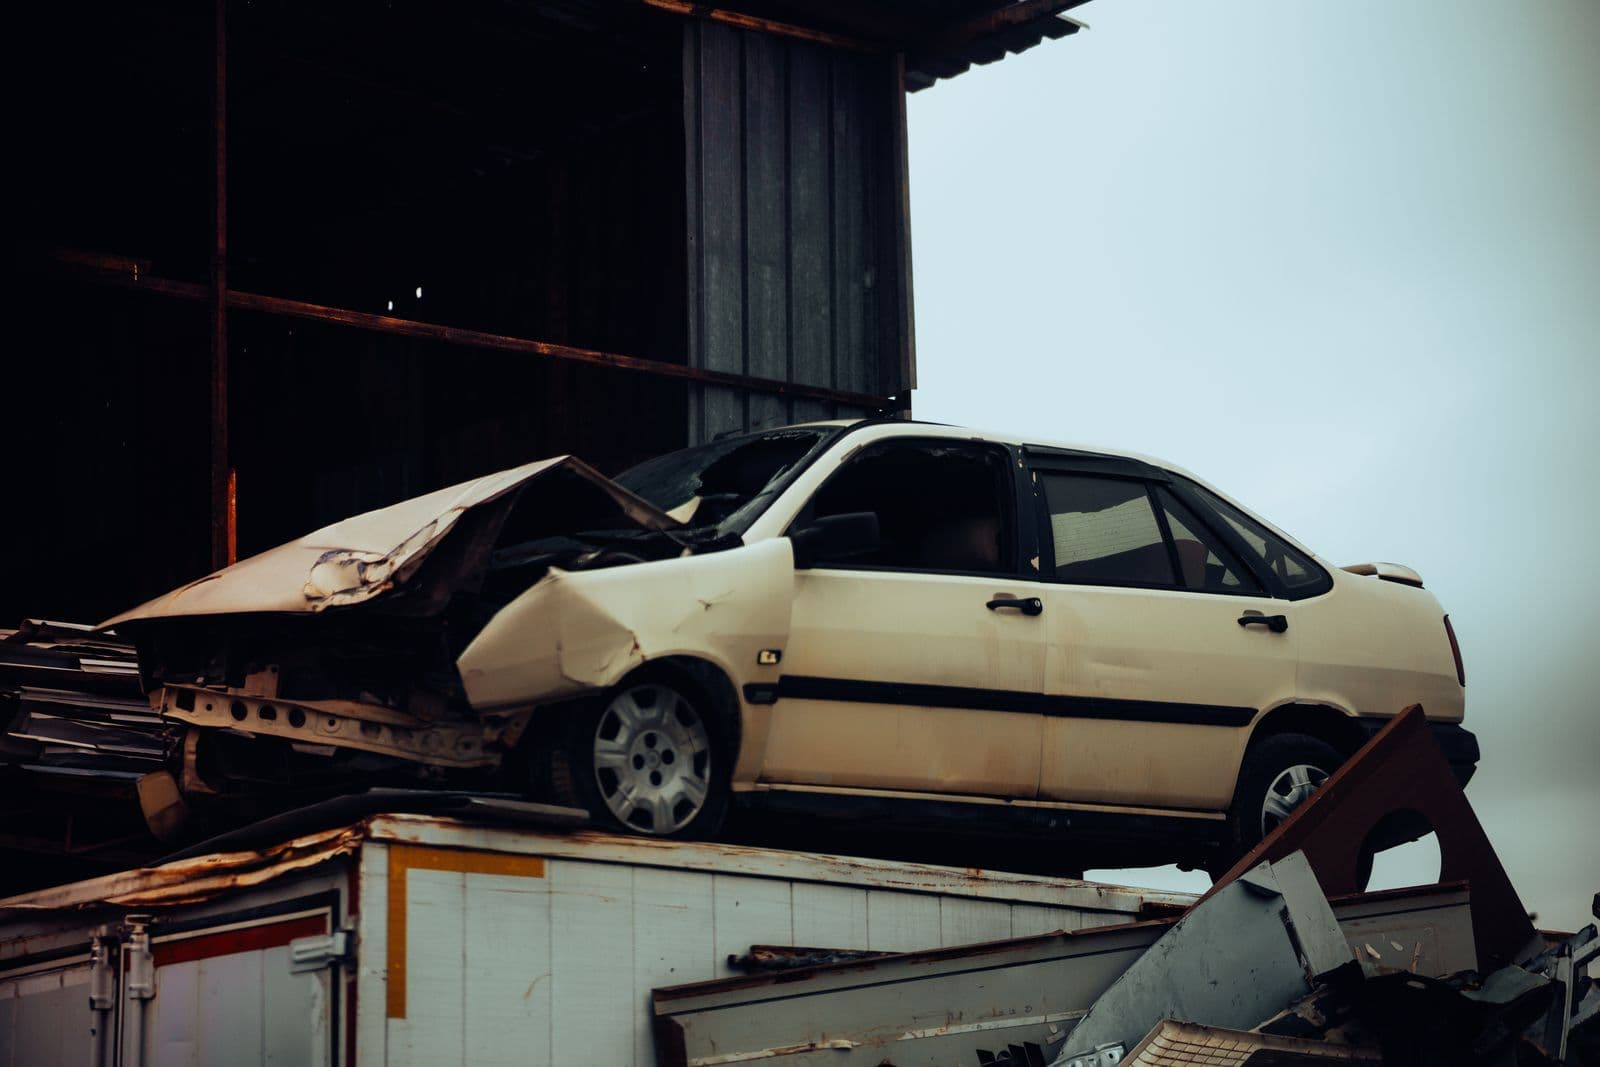
Most of this series argues that a modern car has less margin than an old one. Crash safety is where the trade ran the other way. Regulator, insurer and peer-reviewed datasets agree that occupant death risk is lower in a newer vehicle, and they measure the reasons one at a time - but each measurement comes with a specified set of conditions, and outside those conditions the protection is not there.
- Applies to
- Australian used cars, 1990s stock against current
- Direction
- Contradicts the older-is-better premise
- Evidence
- Regulator, insurer and peer-reviewed crash datasets
- Weakest for
- Pedestrians, unlit roads, rear seats, light cars
- Australian data
- ESC and roll stability measured on local crash records
What the record actually shows
The Insurance Institute for Highway Safety tracks driver deaths per million registered vehicle years, and it deliberately measures only vehicles aged one to three years - so the series tracks how safe cars were when new in each year rather than how a single cohort ages. On that measure, driver death rates fell from 170 per million in 1978 to 89 in 2000 to 36 in 2024 (opens in a new tab), roughly a 60% fall since the turn of the century.
That number cannot be handed entirely to vehicle design. Over the same period road design, speed and drink-driving enforcement, belt-wearing rates and trauma care all changed, and the series cannot separate them.
A cleaner test holds the crash constant. In a cohort of 81,145 drivers drawn from US fatal crash records for 2016 to 2021, driving a vehicle 6 to 15 years old was associated with a 19% higher risk of being the driver who died, and a vehicle over 15 years old with 31% higher risk (opens in a new tab), compared with a vehicle five years old or newer. That study is conditional on a fatal crash having happened, so it measures who dies given the crash, not the odds of crashing - and it adjusted for driver sex, restraint use and crash year only, not impact speed or road type.
Note the size of that figure. The widely repeated line that a driver of a 15-year-old car is four times more likely to be killed is not supported by anything we could reach at primary source. The verified number is 1.31, not 4.
The mechanisms, measured one at a time
The useful part is that the gap is not one mystery improvement. It decomposes, and Australia has its own measurements for the two that matter most on our roads.
| What | Measured effect | Where measured |
|---|---|---|
| Electronic stability control | 27% fewer single-vehicle injury crashes for cars, 68% for four-wheel drives | Australian and New Zealand crash data, 7,699 vehicles (opens in a new tab) |
| Roll stability control | Rollover risk ratio 0.76, a 24% reduction | Australasian data, high centre-of-gravity vehicles (opens in a new tab) |
| Head-protecting side airbags | 37% lower driver death risk in cars, 52% in SUVs, driver-side impacts | US field data (opens in a new tab) |
| Forward collision warning with AEB | 50% fewer front-to-rear striking crashes | US police-reported crashes, 2010 to 2014 (opens in a new tab) |
Each of those is narrow by design. Stability control brakes individual wheels to arrest a yaw the driver did not ask for (opens in a new tab), which is why the benefit concentrates in loss-of-control events and why that study did not establish a clear effect on multiple-vehicle crashes. Side curtain airbags help in a near-side impact and do not transfer to frontal or far-side crashes (opens in a new tab) - and whether a particular used car has them is a specification question rather than a model-year one, so check the individual build's equipment list instead of assuming by age.
The same paper that found older vehicles deadlier also found each additional driver-assistance technology fitted was associated with a 6% lower risk of driver death (opens in a new tab), on a crude count of zero to four systems that treats dissimilar technologies as interchangeable.
It is worth watching how far regulator projections run ahead of field measurement. NHTSA's stability control rule cited a 34% reduction in single-vehicle passenger car crashes (opens in a new tab); the later Australasian evaluation measured 27%. Same direction, smaller number, measured on our own roads.
Specification replaced fitment
The AEB mandate shows the shift from tolerant engineering to specified engineering more plainly than anything else here. NHTSA's rule states that approximately 90% of new light vehicles manufactured in 2022 already had an AEB system, but only approximately 65% met the relevant test procedures (opens in a new tab). The rule therefore buys performance - operation up to 145 km/h for lead-vehicle AEB, 73 km/h for pedestrian AEB, and capability in darkness - not first fitment, with a compliance date of 1 September 2029.
That is why its estimate reads so small. The rule is "estimated to save at least 362 lives and mitigate 24,321 non-fatal injuries a year", which is the marginal benefit of raising required performance on a fleet that was mostly already equipped. It is not the benefit of AEB itself; that is the 50% front-to-rear reduction above. Australia is not bound by the US rule.
Where the gains stop
Newer is not safer for people outside the car. US pedestrian deaths rose 72% from their 2009 low to 7,080 in 2024, 18% of all crash fatalities (opens in a new tab) - over exactly the period occupant protection improved. Front-end shape is the mechanism usually offered for that, but we could not reach a primary source for the hood-height or the car-versus-pickup pedestrian injury figures that are quoted alongside it, so we are not printing those numbers. "Buy newer" and "safer for everyone" are not the same sentence, and we could not find an Australian study quantifying the difference locally.
Pedestrian AEB has documented blind spots that sit where pedestrians actually die. It reduced pedestrian crash risk by 25 to 27%, but showed no evidence of effectiveness in dark conditions without street lighting, at speed limits of 50 mph or above, or when the equipped vehicle was turning (opens in a new tab) - and NHTSA's own rule states more than three-quarters of pedestrian fatalities occur in conditions other than daylight. Front crash prevention is also weaker against the road users it matters most for: 53% effective when striking another passenger vehicle, but 38% against trucks and 41% against motorcycles (opens in a new tab).
Mass and size are a separate axis from model year. IIHS states the mechanism plainly: in a two-vehicle crash the heavier vehicle pushes the lighter one backward, putting less force on its own occupants and more on those in the lighter car (opens in a new tab). Its 2024 rates by body type - cars 58, pickups 34, SUVs 27 driver deaths per million (opens in a new tab) - show that effect persisting inside the current model years. A light new small car is not automatically safer than a heavy older large one in a vehicle-to-vehicle impact.
Compatibility did improve, but the gain belongs to the newer striking truck, not to the older car being hit. Comparing fatal crashes between near-new vehicles in 2011-2016 and 2017-2022, IIHS researcher Samuel Monfort found pickups went from killing car drivers at 2.5 times the rate of a striking car to 1.9 times, and SUVs over 5,000 lb from 1.9 to 1.2 times (opens in a new tab), credited to aligning energy-absorbing structures. Both vehicles in that study were one to four years old, a substantial pickup penalty remains, and Monfort reports curb weight's protective benefit plateaus around 4,000 lb, beyond which extra weight mostly raises the risk to the other vehicle.
The rear seat lagged the front. Sled testing showed pretensioning and force-limiting rear belts cut peak chest deflection by 29 to 38% at 48 km/h, while noting those features are more common in front seats (opens in a new tab) - a known protection that was not deployed everywhere.
And the improvement is not monotonic. IIHS notes its own rates for 2021 to 2024 sit above the 2019 low point (opens in a new tab), even as new vehicles kept scoring better on test. Buying newer is not sufficient on its own.
The star on the listing is not a fixed unit
Crash test scores do carry real information: a European comparison found five-star cars showed about 23% lower risk of fatal or serious injury than two-star cars (opens in a new tab), under the protocols in force in 2010.
The catch is that the scale moves. ANCAP states its testing criteria are updated every three years, that ratings from different periods are not comparable, and that buyers should choose a vehicle with a datestamp no older than six years (opens in a new tab). A 2012 vehicle advertised as five-star ANCAP is telling the truth and creating a false impression at the same time.
Reading a used listing's ANCAP stars as current-standard safety without checking the datestamp - a five-star result from an earlier protocol is not the same test a current five-star car passed.
For most of the used fleet there is no current ANCAP rating at all. The Used Car Safety Ratings, built from real Australian and New Zealand police-reported crash data and published consumer-side at howsafeisyourcar.com.au (opens in a new tab), cover vehicles ANCAP never rated. We could not retrieve their crashworthiness figures broken down by year of manufacture for this article.
What we could not verify
Several of the most-quoted items in this argument did not survive a check at source, and we are not going to print them:
- The ANCAP 1998 versus 2015 Toyota Corolla demonstration crash, and the Euro NCAP comparison commonly described as a 1997 Rover 100 against a 2017 Honda Jazz. We could not reach a primary release or test report for either, so we will not describe dummy readings nobody has read.
- The line that pre-2000 vehicles are about 20% of the Australian fleet but about a third of fatalities. We could not reach an ANCAP, BITRE or Commonwealth primary source stating it.
- Australian Design Rule mandate dates for stability control and advanced emergency braking. These are quoted inconsistently across secondary sources and we could not reach the instruments to confirm them.
- The hood-height and car-versus-pickup pedestrian injury percentages that circulate with the front-end-shape argument. We could not reach the underlying studies, only a general topic page, so the numbers stay out.
The honest summary is narrower than the headline but stands up: on the evidence we could verify, a newer car protects the people inside it better, for identified and separately measured reasons, in the crash modes those systems were specified for. Outside that specification - in front of the car, in the dark, in the back seat, or against something much heavier - the margin is a good deal thinner than the brochure implies.